
Why “sales are up but the money isn’t”
This is one of the most common things owners of trading and distribution businesses say: turnover grew, the godown is busy, and yet the bank balance does not reflect it. Ask what the margin is and the answer is usually a single number — “we make around 12% on everything”. That number was true once, for some products, for some customers.
Here is where it quietly stops being true:
- Purchase price changed, selling price did not. The supplier raised rates twice this year. The price list your salesmen quote was last updated before both increases.
- Freight and handling are treated as overheads. The transporter is paid in cash or at month-end and booked as a general expense. It never gets added to the cost of the goods it carried, so heavy, low-value products look far more profitable than they are.
- Discounts are given verbally. An extra 2% for a big party, a free carton on 20, rounding off the bill. None of it lands in a sheet that anyone analyses.
- Returns, damages and short supply. Broken cartons, expired stock and goods sent back rarely get charged against the product or customer that caused them.
- Credit has a cost. A customer who pays in 90 days is using your money for 90 days. If you run on a CC limit or borrowed funds, that interest is part of what that customer costs you.
- Markup and margin get mixed up. Buying at ₹100 and selling at ₹120 is a 20% markup but only a 16.7% margin. Plan with the wrong one and every estimate is too optimistic.
Your accountant’s profit and loss statement will be correct for the business as a whole. What it usually cannot tell you is which products, customers and orders produced that profit, and which ones ate into it.
A worked example
An illustrative example (the numbers are made up, the pattern is not). A distributor buys a carton of a product at ₹800. Inward freight works out to ₹40 a carton and loading, unloading and godown handling to ₹10. Landed cost: ₹850, not ₹800.
- Customer A pays list price of ₹950 within 15 days. Margin: ₹100 a carton, 10.5%.
- Customer B is a large account with a 5% discount, so pays ₹902.50, on 75-day credit. Margin before credit cost: ₹52.50, or 5.8%. At 12% a year, carrying ₹902.50 for 75 days costs about ₹22. Real margin: roughly ₹30 a carton, about 3.4%.
Measured against the purchase invoice alone, Customer A looks like ₹150 a carton and Customer B like ₹102.50. In reality, the big customer everyone is proud of earns less than a third of what the smaller one does. Add a free delivery and one damaged carton a month, and that account may be losing money.
Steps that work even without new software
You can do this in Excel if you are consistent. Start with your top 20 products and top 20 customers; that is usually most of the turnover.
- Calculate landed cost per unit. For each purchase, add purchase price, inward freight, loading and unloading, packing, insurance and, for imports, customs duty and clearing and forwarding charges. Divide by units actually received in good condition. When one freight bill covers several products, split it by weight, volume or value — pick one rule and use it every time.
- Pick one costing method. Either a weighted average of landed cost across purchases, or the latest landed cost. Weighted average is steadier; latest cost warns you sooner when rates rise. Mixing both makes the numbers meaningless.
- Record the net selling price on every line. After trade discount, cash discount, schemes and free quantity. If 20 cartons were billed and 1 was free, the price per carton is the bill amount divided by 21.
- Calculate margin per line. Margin = (net selling price − landed cost) × quantity. Margin % = margin ÷ net revenue. Keep it at line level; averages hide the problem.
- Roll up by product, customer and order. A pivot table on the line data gives you all three. Sort from lowest margin to highest. The bottom of each list is where your attention should go.
- Add the cost of serving each customer. Delivery you pay for, and credit cost: amount outstanding × your interest rate × days ÷ 365. This is where profitable-looking accounts often turn thin.
- Review monthly and act. Reprice products where cost moved, renegotiate discounts or credit days with thin-margin customers, change suppliers where landed cost is out of line, or stop pushing products that do not earn.
The hard part is not the formula. It is getting purchase costs, freight and discounts recorded consistently by several people, every day, in a form you can analyse.
Comparing your options honestly
| Option | Good for | Limitation for product-level profit |
|---|---|---|
| Price list and gut feel | Very small ranges with stable costs | No view of discounts, freight or credit cost; margin is assumed, not measured |
| Excel costing sheet | A one-off analysis or a small, stable catalogue | Only as current as the last update; purchase and sales data must be copied in by hand, so it drifts |
| Accounting software such as Tally | Accurate business-wide profit and loss, stock valuation and compliance | Item-level margin depends on how purchases, expenses and discounts are posted; freight is often booked as a general expense rather than to products |
| Dashboards or BI tools on top of sheets | Visualising data you already keep well | They chart what is fed in; they do not fix missing costs or unrecorded discounts |
| Operations system such as BOOM | Businesses where orders and purchases are already recorded daily by a team | Needs purchases and costs entered properly; a one-time investment that suits a certain scale |
How this works in BOOM
In BOOM, profit is not a separate spreadsheet. It is calculated from the orders and purchases your team already records, so cost sits next to revenue without anyone building formulas.
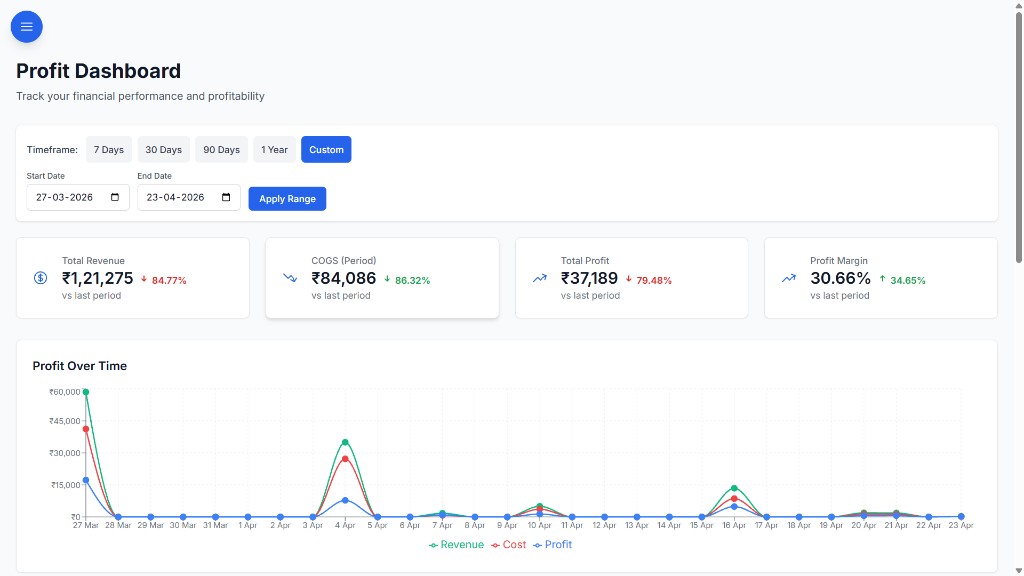
- Revenue, COGS, profit and margin over time on one dashboard, with 7-day, 30-day and custom date ranges.
- Top-performing and loss-making products are flagged, so the products quietly eating margin surface without a monthly pivot table.
- Product performance tied to inventory, so slow-moving, low-margin stock is visible next to what sells.
- Purchases linked to suppliers and products, which is where cost comes from. Components like freight allocation are set up during customization to match how you actually buy.
- Customer and order-level views build on the same order data; the exact reports you need are scoped during implementation.
- Role-based access keeps margin data with the owner and managers, while staff work on orders without seeing cost prices.
- Export-ready analytics for your own review or your CA.
One honest caveat: BOOM calculates from what is recorded. If purchases are entered late or discounts are given off-system, the dashboard will be wrong in the same way a spreadsheet would be. The advantage is that recording happens once, as part of the daily work, instead of as a separate costing exercise.
When BOOM is not the right fit
- You need statutory profit and loss or a balance sheet. That is your accountant’s job and their accounting software. BOOM gives operational profit visibility; it does not replace your books.
- You sell a few products with stable costs. A one-time Excel analysis, repeated each quarter, may be all you need.
- Purchases are not recorded as they happen. Any system will show wrong margins. Fix the recording habit first.
- You want a cheap monthly subscription. BOOM is a one-time license from ₹2,00,000, installed on your own server.